 | I receive Covid-19 patients report everyday that I save in a folder. These reports have similar data-set and I have to create a consolidated report using these multiple files. |
To know how to do above action, click on the tab according to your software preferences
- Find and connect data through a large array of sources.
- Combine and shape data sources to suit your data analysis requirements or prepare them through software such as Power Pivot and Power View for further study and modeling.
- Creates custom views about the results.
- Perform operations to clean the records.
- Import the data from a variety of log files.
- Pull the data into Power Pivot as refresh connections from new data sources such as XML and File Folders.
Microsoft Excel Pro tip:
You can create a chart and required insights by consolidating all excel files within a folder.
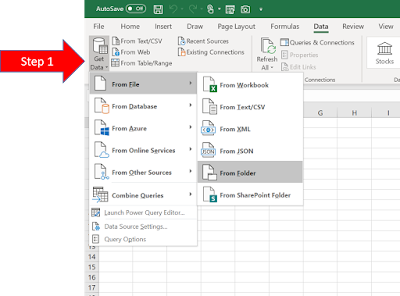
STEP 1: Open Microsoft Excel, and click Data > Get data > Frome File > From Folder. Select folder that contains your excel files.
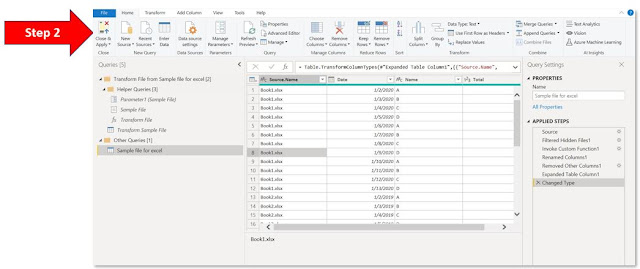
STEP 2: Click Combine > Combine & Transform Data. Combine Files window opens, click OK. A Power Query Editor window opens. Shape the data according to your need. Click Close & Load.

STEP 3: Convert your table to pivot table and create a graphical report from the consolidated data.
Power BI Pro Tip:
Microsoft Power BI can create a chart and required insights by using your excel data.STEP 1: Open POWER BI, and click Get data > Folder. Select folder that contains your excel files.

STEP 2: Click Combine and Transform data and click OK. A Power Query Editor window opens. Shape the data according to your need. Click Close & Apply.
STEP 3: Do one of the following:
- Click
(Chart): To create different types of chart from your consolidated data
- Click
(Table): To view your consolidated table and corresponding data

Comments
Post a Comment
Thank you! for visiting this site.